
The desert of Hot Neptunes
Since the discovery of the first exoplanet around a solar-like star in 1995, researchers have detected more than 5000 planets in our galactic neighborhood, most of them orbiting very close to their star. If the diversity of these new worlds ranges from gas giants the size of Jupiter or Saturn to smaller planets the size of Mercury, including rocky planets larger than the Earth, gas planets the size of Neptune seem to be missing. Astronomers call Hot Neptune Desert this empty region in the Period-Radius plot of all the known exoplanets. Why this anomaly in the distribution of exoplanets?
Thanks to data taken with HARPS-N installed at Telescopio Nazionale Galileo and HARPS located on the 3.6-m telescope of ESO, researchers from the University of Geneva and the PlanetS National Centre of Competence in Research reveal the eventful migration history of planets bordering the Hot Neptune Desert.
"The distribution of planets close to their star is shaped by a complex interaction between atmospheric and dynamical processes, i.e., the motions of the planets over time," comments Vincent Bourrier, principal author of the paper. "Today we have several hypotheses to explain this desert but nothing is certain yet and the mystery remains". Using a technique combining the two main methods of studying exoplanets (radial velocities and transits methods), the team was able to establish that a part of these exoplanets has migrated in a turbulent way near their star, which pushed them out of the orbital plane where they were formed. In particular, "Analyzing the radial velocities during the transit of a planet allows to determine if it orbits around the stellar equator, around the poles, or if the system is in an intermediate configuration" explains Omar Attia, second author of the study. Following this method, the team was able to show that most of the planets in their sample have an orbit misaligned with the stellar equator. "We found that three-quarters of these planets have a polar orbit (they rotate above the poles of their star), which is a larger fraction than for planets further away from the desert. This reflects the role of disruptive migration processes in the formation of the desert," summarizes Bourrier.
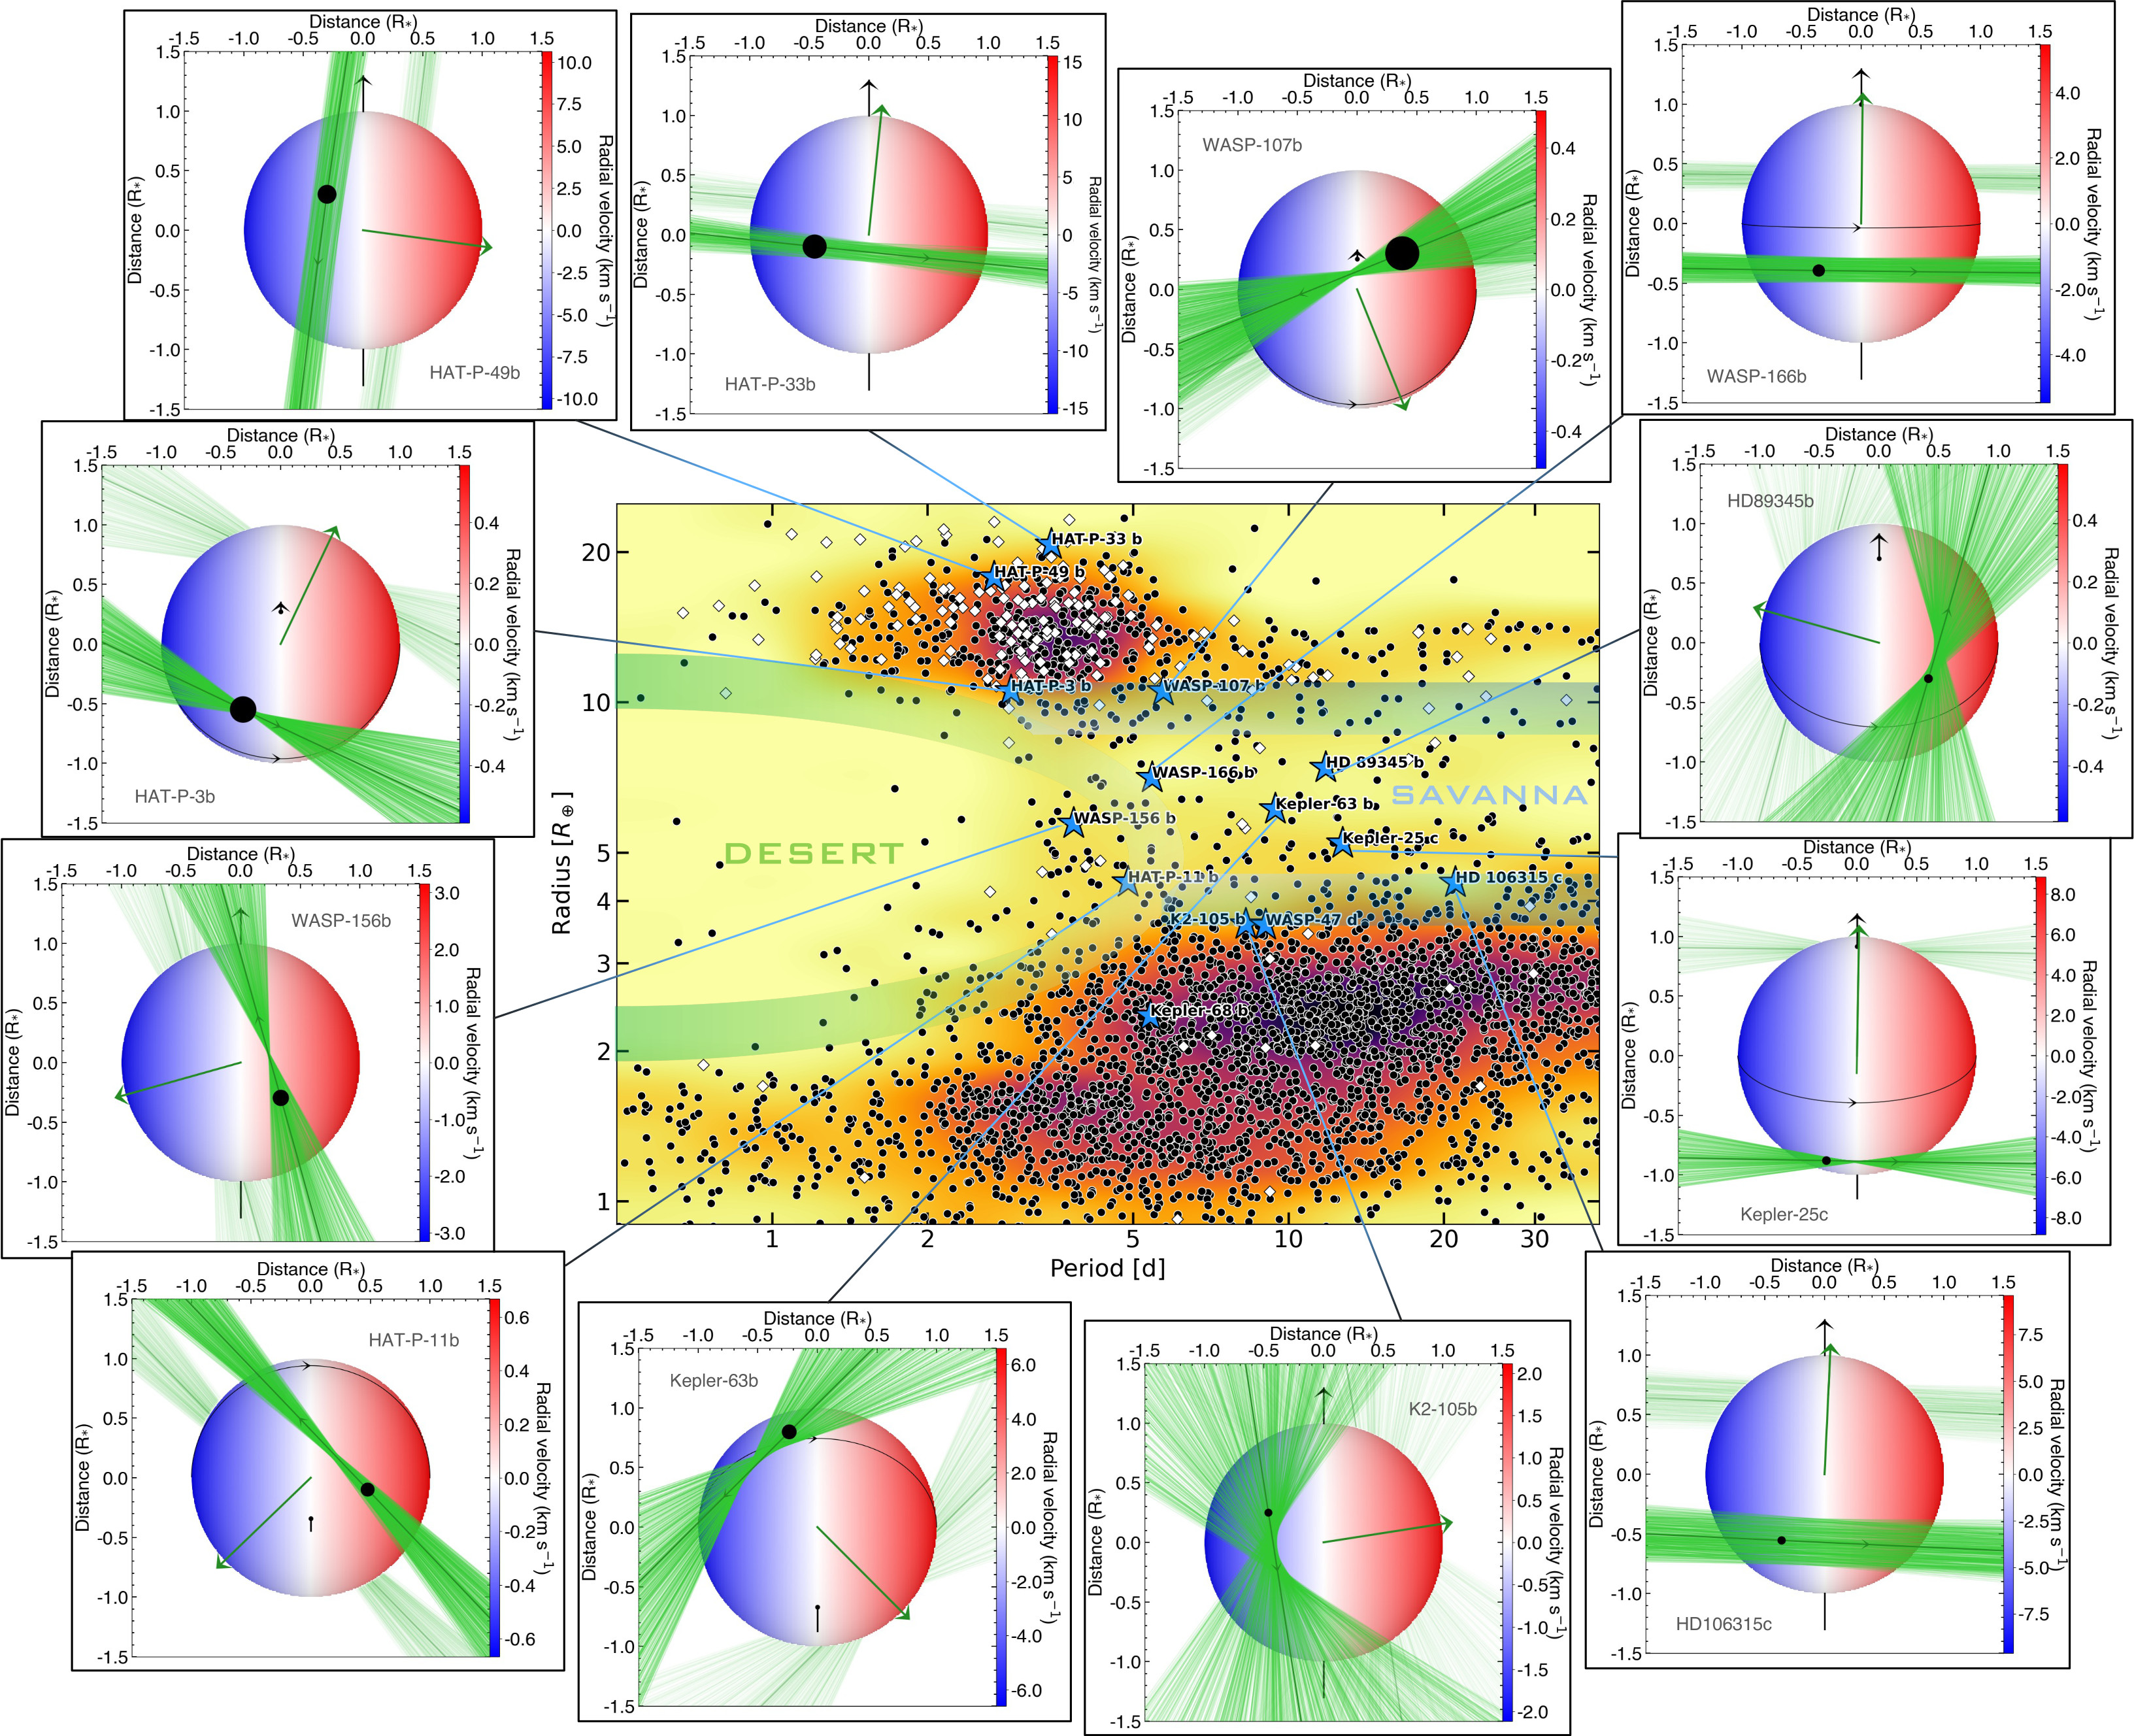
Figure: Distribution of close-in exoplanets as a function of their radius and orbital period. Green and blue contours show the approximate boundaries of the Neptunian desert and savanna. White squares indicate exoplanets with measured spin-orbit angles. Blue stars highlight planets in our sample, whose projections on the sky plane are displayed for the best-fit orbital architectures. By default, we show the configuration where the stellar spin-axis (shown as a black arrow extending from the north pole) is pointing toward the Earth, except for HAT-P-11 and Kepler-63 for which the degeneracy on i* is broken and favors the configuration where their south pole is visible. The stellar equator, plotted as a solid black line, is shown only in systems where the stellar inclination (and thus the 3D spin-orbit angle) is constrained. The stellar disk is colored as a function of its surface RV field. The normal to the planetary orbital plane is shown as a green arrow extending from the star center. The green solid curve represents the best-fit orbital trajectory. The thinner lines surrounding it show orbits obtained for orbital inclination, semi-major axis, and sky-projected spin-orbit angle values drawn randomly within 1 σ from their probability distributions. The star, planet (black disk), and orbit are to scale for a given system.
Link to the paper: https://www.aanda.org/articles/aa/full_html/2023/01/aa45004-22/aa45004-22.html